Organize data in a table
To help organize a table, you can sort the data, organize data in a group or section, suppress duplication, and control page breaks.
Sort data in a column
When you insert data in a table, data rows appear in the sort order specified in the data set, if a sort order is specified. If no sort order is defined, data rows appear in the order in which they were added to the database. You can arrange the data rows in a meaningful order by sorting the data. For example, you can sort a list of employees by location, then by cost center, and then by manager name.
Sort on a single column
- Select and right-click the column.
- Select or Sort Descending.
Sort on multiple columns
You can sort data by as many as three columns. When you sort by multiple columns, you use the Advanced Sort glance. It is important to understand the order of precedence for a multiple sort action. From the Advanced Sort glance, select the columns in the order in which you want to sort the data. For example, to sort data by location first, then by cost center, and then by employees within each cost center, select the columns in that order.
To sort data on multiple columns
- Select and right-click a column.
- Select .
- In Advanced Sort glance, in first Sort By field, select a column from the list, then select either Ascending or Descending.
- In the first Then By field, select a column from list, then select either Ascending or Descending
- In the second Then By field, select a column from list, then select either Ascending or Descending
- Click Tap OK.
Revert data to its original order
- Select and right-click a column.
- Select for each column containing sorted data, then click tap Select a Column from the drop-down list.
- Click Tap OK.
Organize data in groups
Data groups contain related data rows. For example, you can create a table that lists items by category—all employees in one group, all managers in another group, and so on. Organizing data in groups makes it easier to compare and analyze information.
When you group data, you can:
- Add subtotals, counts, averages, or other aggregate information at the beginning or end of each group.
- Insert a page break before or after each group to start each data group on a new page.
- Hide the details of each group to view a summary report.
When you group data, you can also:
- Remove duplicate values for each group.
- Sort the values of each group. For example, a country group displays the countries in alphabetical order.
- Generate a table of contents that displays the values of every group when you view the finished report in the viewers. The table of contents allows you to navigate to specific locations in the report. This feature is particularly useful when a report contains many pages.
Group data
- Select and right-click the column that contains the values to group.
- Select
If the column you selected contains string or numeric data, the data is grouped by each unique value in the column. If the column you selected contains date-and-time data, additional grouping options appear.
Group data on a date-and-time column
When you group data on a date-and-time column, you have an additional option to group the data by a specific time interval, which is the typical option. You can organize a total hours report, for example, showing hours data by month or by quarter, rather than by individual date.
To group date-and-time data:
- Select and right-click the column that contains the date-and-time data.
- Select .
-
In the Group Detail glance, select one of the group options. For example, you can group on Signed off through a specific day, group using individual values, or group by interval. If you group by interval:
- Select an interval type, such as weeks, months, or quarters, from the drop-down list.
- Type a number to indicate the grouping for the selected interval type. For example, select Weeks and type 2 to group data in two-week periods.
Group on multiple columns
When you group data on multiple columns, consider the order of precedence before you create the groups. To group employee data by state, then by city, create the groups in that order.
Change the grouping order
After you create groups, you can change their order to provide a new perspective on the report data. Evaluate the effect of changing the grouping order, so that the organization of columns remains logical.
To change the grouping order
- Select and right-click a column.
- Select .
- In Reorder Columns, select the grouped column from Available Columns. Use the up or down arrow buttons to move the column up or down the list.
- Click Tap OK.
Organize data in sections
You can also organize table data into sections. A section is functionally equivalent to a group. When you create a section, you are also grouping data. Like groups, you can create multiple sections, calculate aggregate data for each section, start each section on a new page, and hide the details of each section.
One difference between a section and a group is how the information is arranged.
Organizing data in sections reduces the overall width of the table.
- You can insert multiple charts, one in each section, to reflect the aggregated data in each section. In a table that contains data groups, you can display only one chart, which presents the aggregated data for the overall table.
- You can display additional data fields in a section heading. By default, a section heading displays only a label and the section value. The data fields used in the table are available for addition to a section heading.
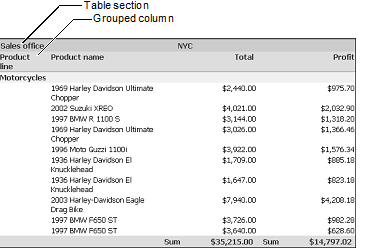
You can use both groups and sections in a single table. Figure 18-8 shows a table that contains the same data as the previous example, except the sales office column is a section, and the product line column is a group. If a column contains date-and-time data, you can create sections based on individual date values, or you can create sections that group dates by interval.
Create a section
1. Select and right-click the column that contains the data to organize in a section.
2. Select .
Add content to a section heading
1. Select and right-click the section heading, then select Section Heading. A dialog box displays a list of the data fields that are in the table.
2. Select the data field to add to the section heading.
3. Click OK. The data field appears in the section heading.
If you do not see a data field you want to use, add it to the table so that it is available in the Data Field dialog box.
Delete a section
You can delete a section to reorganize data. When you delete a section, the values in the section do not reappear in the detail rows. Instead, the values appear in a grouped column. Any aggregate data for the section is deleted. Any chart you inserted in the section is also deleted.
To delete a section, select and right-click the section heading, then select .
Suppress duplicate values
Sometimes a column displays duplicate values in consecutive data rows. When the duplication is unnecessary or makes the report difficult to read, it is useful to suppress consecutive duplicate values. You can use Report Studio to suppress duplicate values that appear in a grouped column by moving data rows from the column to the group header.
Suppress duplicate values in a column
If a column extends across multiple pages, the first row on each page displays a value, even if duplicate values are suppressed for that column.
- To suppress duplicate values in a column, select and right-click the column containing duplicate values. Select .
- To show hidden duplicate values in a column, select and right-click a column that does not repeat duplicate values. Select
Suppress duplicate values in a group
In a grouped column containing repeated values, you can avoid repetition by moving the data row values to the group header so that they only appear once.
To suppress duplicate values in a grouped column:
- Select and right-click the column with the duplicate values. Select .
- In the Move to Group Header dialog box, select the group header to which you want to move the data row values, if the table contains more than one group.
- Repeat steps 1 and 2 for each column for which you want to move data row values to the group header.
Start each group or section on a new page
Lengthy reports or reports that consist of distinct sections typically look more organized if each section appears on a separate page. As you design a report, make sure you periodically view the generated report to see if you need to set page breaks to make the report more usable. You can set a page break for each group and section you create.
- Select and right-click a grouped column or section heading. Select or .
- In the Page Break dialog box, select After or Before from the drop-down list to insert a page break after or before a group or section.
-
If you select
After, do one of the following:
- Select Always to always insert a page break after each group or section.
- Select Always except last to always insert a page break after each group or section, but not after the last one. This is the typical option to avoid a blank page at the end of the report.
-
If you select
Before, do one of the following:
- Select Always to always insert a page break before each group or section.
- Select Always except first to always insert a page break before each group or section, but not before the first one. This is the typical option to avoid a blank page at the beginning of the report.
- Select None to remove an existing page break.
- Select OK. Run the report to view the modified design.